New satellite estimates point to a shift in India’s air pollution story. The data shows that unhealthy air now reaches far beyond major cities and covers entire districts and airsheds. It also points to a sharp rise in year-round pollution in the Northeast. The findings come from a new assessment released on November 25, 2025, by the Centre for Research on Energy and Clean Air.
The report uses high-resolution satellite measurements to track fine particulate matter, or PM2.5, across states, districts, and seasonal airsheds. The authors used a machine-learning framework to combine ground readings, aerosol data, and weather variables. The method produces district-level estimates for all seasons and fills gaps in the national monitoring network.
What satellites found across India
The study shows that 447 of 749 districts, or about sixty per cent, crossed the National Ambient Air Quality Standard of 40 micrograms per cubic metre. No district met the World Health Organization’s guideline of 5 micrograms per cubic metre. The numbers place the long-standing focus on “non-attainment cities” in a new light, as large rural and peri-urban areas also face high exposure.
The Indo-Gangetic airshed remains the most polluted region. The northern plains recorded high values in winter, post-monsoon, and even summer. The pattern matches previous evidence that emissions from power plants, industry, household fuels, crop residue burning, and transport settle over a wide area during low-wind periods. The study describes an airshed as a shared zone where pollutants mix and drift across districts and state lines.
The new finding is the scale of pollution in the Northeast. States such as Assam and Tripura reported high PM2.5 in all four seasons. The report notes that even during the monsoon, when most of India sees cleaner air, these states recorded elevated values. “The Northeast is now facing a year-round crisis,” the researchers wrote.
Delhi again stands at the top of the list of polluted regions. The national capital reported an annual mean PM2.5 level of 101 micrograms per cubic metre. This is two and a half times the national limit and twenty times the WHO guideline. The pattern held in all seasons. Winter values in Delhi’s districts crossed 100 micrograms per cubic metre, while summer values stayed well above the national standard.
The concentration of pollution in Delhi and its neighbouring states is clear in the district-wise list. Delhi and Assam each account for eleven of the top fifty districts. Bihar and Haryana follow with seven each. Other districts in Uttar Pradesh, Tripura, Rajasthan, West Bengal, Chandigarh, Meghalaya, and Nagaland also appear in the list.
Why pollution spreads beyond cities
The report warns that state averages can hide local hotspots. Maharashtra is one example. The state’s average sits near the national limit, but fourteen of its districts still cross the threshold. Chandrapur is among them due to a large cluster of coal-based plants and mines. The authors note that many districts with mixed readings have sparse ground monitoring, leaving parts of the region under-reported. The national network remains stronger in large cities and weaker in rural or industrial belts.
Seasonal variation remains clear. Winter brings the worst conditions. About eighty-two per cent of districts crossed the national limit between December 2024 and February 2025. During the monsoon, this dropped to about ten per cent as rain washed pollutants from the air. The relief faded quickly once the rains ended. Three out of four districts again crossed the limit in the post-monsoon months.
States such as Uttar Pradesh and Madhya Pradesh show a sharp swing. Both record high values in winter and post-monsoon but see districts fall below the limit in the monsoon. In contrast, Assam, Delhi, Punjab, and Tripura record elevated levels even in the wet season. Assam saw twenty-one districts cross the limit during the monsoon. Tripura saw six. This points to strong baseline emissions that seasonal winds cannot offset.
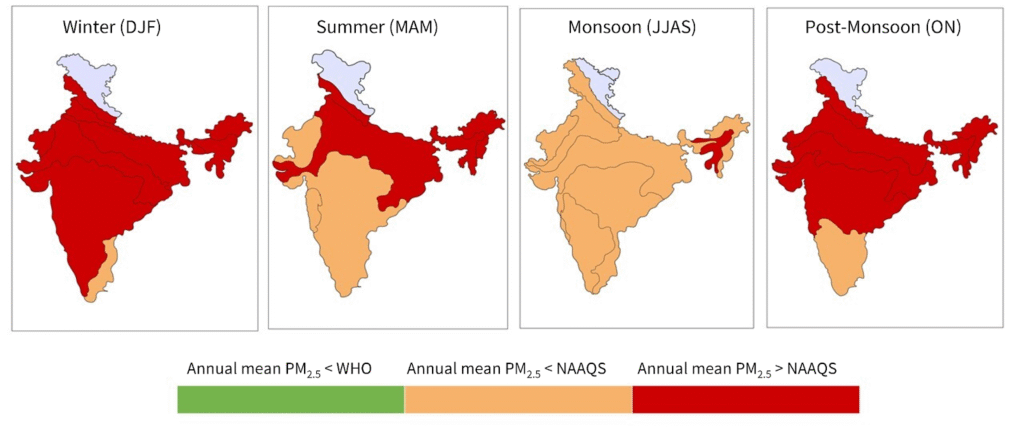
How Northeast became year-round hotspot
Satellite-based analysis also helps trace shifts in airsheds over the year. Weather patterns can stretch or compress these zones. The winter map shows large red patches across northern and central India. Summer brings some relief in western and southern regions, but not in the northern plains. The monsoon map shows near-uniform improvement except in the Assam–Tripura airshed. Once the rains pass, the post-monsoon map again shows high readings in most northern and eastern airsheds.
The report notes that India’s current clean-air plans are not designed for such wide variations. Policy tools focus on 131 cities labelled as non-attainment under the National Clean Air Programme. Many of these cities have made progress in expanding their ground network. Yet large parts of the country remain unmonitored or under-monitored. The authors write that “action must move to the district level and the airshed level” to match the scale of the crisis.
Where districts face highest exposure
The recommendations include integrating satellite data into routine air-quality tracking under the national programme. The authors state that this would help fill gaps in regions where no ground stations exist and improve assessment of exposure for districts with large populations outside city borders. They also call for stricter tracking of sectoral emissions from coal plants, industry, transport, waste burning, and household fuels.
The study points out that India’s clean-air plans often rely on seasonal measures, such as bans on construction or limits on vehicle entry during winter peaks. The authors argue that “short-term responses cannot replace year-round control of major sources.” The year-round pollution in the Northeast strengthens this point.
The human impact of these findings is clear in several regions. Farmers in eastern Assam reported smoky conditions in August 2024 despite heavy rain. Residents in Tripura described hazy mornings during months that usually bring clear skies. In Bihar and Haryana, winter pollution again forced limits on outdoor activity in schools and public spaces. In Delhi, residents said daily exposure felt “constant” even outside winter.
How shifting airsheds reshape pollution
The report says satellite-based tracking now offers a tool for faster response. Population-weighted values can help states focus on districts with the highest exposure. Airshed maps can show where pollution crosses state lines, pushing authorities to plan joint action. Data at this scale can also support routine checks on whether emissions fall after specific interventions.
The assessment covers data from March 2024 to February 2025. It uses population grids from NASA’s SEDAC to weight exposure. It also uses seasonal airshed boundaries based on earlier research. The authors state that this combination produces a more complete view of how pollution spreads across India.
The study closes with a clear message for policymakers. Pollution is no longer limited to major cities. It affects districts, states, and entire airsheds across seasons. Some regions now face high exposure throughout the year. The new satellite data shows where the problem is growing and where relief remains short. The challenge is to match this information with long-term action that reaches beyond city borders and addresses pollution at its source.
Support us to keep independent environmental journalism alive in India.
Keep Reading
Small Wild Cats in Big Trouble: India’s First National Report Released
After Tragedy, Families Face Delays in Tiger Attack Compensation
Stay connected with Ground Report for underreported environmental stories.